Welcome to 2011 everyone! Let me start by announcing that we now have the ability for readers to leave comments at the bottom of a newsletter. So if you want to leave one, please scroll to the bottom. I hope this allows folks to have a dialog about the topic.
Last month’s newsletter was a wrap-up of our 2010 topics. This month we are going to talk about tolerancing parts and assemblies and how they interrelate and drive cost.
An engineer’s worst nightmare is receiving parts for an assembly from various vendors and having them not fit together. The panicked moments that follow will be spent measuring each part, looking at the drawing and tolerances and trying to find the reason with the hope that it wasn’t because of a mistake they made. Hopefully this is a pretty rare occurrence and if it does happen it is because of a manufacturing error and not a design error. If it is a design error, you can be sure the engineer will be doubly careful to not make that mistake again. In the future, they will carefully analyze the tolerances for their mating parts to ensure that no matter what the range of tolerances are that the parts will be made to that they will fit together and work. While this makes sense at first glance there may be more to it when trying to reduce total cost – and just maybe the above scenario is not an engineers worst nightmare after all.
Let me preface this by saying that I am still learning a lot about this topic and I am by no means an expert. There are way smarter people than me who have analyzed this topic in much greater depth. This newsletter is really just a low level overview in relative lay terms written in the hopes of raising the level of awareness for companies who can’t afford a full time engineering statistician.
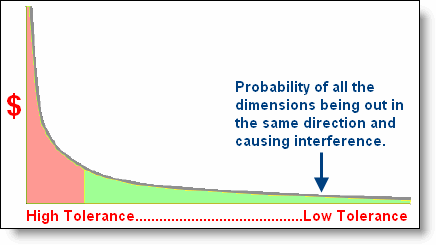
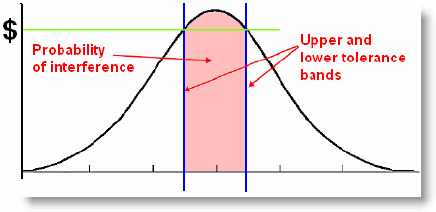
Many of the CAD systems or special software out there now can do tolerance stack-up analysis and let you know what the tolerances would need to be to ensure that you never have an interference condition. Some will even calculate the likelihood of this condition using Root Sum Squared or Monte Carlo methods. While this is a valuable tool and is an important part of good product design, we want to discuss the cost of the tolerances and the manufacturing methods used to produce each of the parts. We recently worked on an assembly of parts – a complex electronics chassis. There were 24 different dimensions across several parts which all affected the final fit of the parts. The potential stack-up in tolerance was enormous and led to impossible tolerances, very expensive parts and a high scrap rate. (This underscores the importance of a smart tolerance scheme to eliminate stack-up). But more importantly it made very evident that the engineer was driving cost by designing the tolerance scheme for the “long tail” without thoroughly considerating the probability of such an event. That is, the tolerance analysis led him to design parts in the assembly that would work if all 24 dimensions were all at the limit of the tolerance in the same direction – and also would work if they were at the limit in the other direction. He was guaranteeing that the parts would always be extremely expensive and the manufacturer would always have trouble building them; all to hedge the bet against the extremely unlikely event that all the tolerances would be out in the same direction. In this example, once all the parts were brought together and assembled there was ample tolerance and everything fit together very loosely. This demonstrated that the averages of all 24 tolerances worked out to about nominal and the assembly was much more expensive than it needed to be. Figures A and B show two different ways of graphically demonstrating this.

Figure A: Longtail graph of machining tolerances.
I am not a statistician, but there is a sweet spot somewhere on the long-tail graph where the cost of the tolerances balance with the probability of having to throw away or rework some parts which do not fit because of the tolerance stack-up. Factors for this equation would be the manufacturing process and ease of holding a high tolerance on each dimension, the cost of holding an inventory of extra parts to replace the occasional one that doesn’t fit, knowing at what point in the manufacturing process the interference would be caught and finally how expensive it would be to rework or replace the part. It is certainly a complex equation and will have to be analyzed on a case by case basis. One significant factor is the slope of the cost/tolerance curve which comes back directly to the process capability of the manufacturing process.

Figure B: Bell Curve showing cost and tolerance comparison.
Here is an example to drive the idea home. Consider a stack of 5 parts and the end tolerance of the stack needs to be +-.010″. The safe way to design the parts is to make them all +-.002″ so that there is never an opportunity for the assembly to be out of tolerance. Let’s assume that it costs 20% more to achieve the +-.002″ on each component. What if we then decide to give each part a +-.010″ tolerance? Now consider the distribution of tolerances in the +-.010″ range assuming a reasonably stable manufacturing process and say that 80% of the parts will fall within 20% of the total range available. That is to say 20% of the parts will be outside of a +-.002″ range. So the factor of .2 needs to be multiplied 5 times to give you a total probability of .032% that the assembly will be outside of the +-.010″ tolerance; clearly a very small number. Even if these assumptions are off 100% and the factor is .4, you are still around just a 1% chance of having the assembly out of tolerance. This is a relatively simple example, but I hope it helps to drive home the concept.
I believe the best path to achieve the lowest cost is to have an open discussion with the manufacturers and engineers about each part and each tolerance for a given assembly. Withhold as little information as possible so that all parties know what the critical requirements are. Making decisions in a vacuum could be worse than not giving the issue any attention at all. It will be an investment of time up front but ROI may be significant of there are lots of parts to be made. Consider doing this with your next project and see what kind of results you get. Please don’t forget to put extra careful thought to your tolerance scheme to reduce the number of variables in the equation.
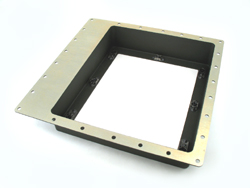
Every month we feature a really cool part that we have made. January’s Part of the Month is a structural 5 axis aerospace part. The hole pattern on the top edge is normal to the surface which has a complex curvature to it. Chem film, masking and paint and then nutplates installed with sealant are added after machining.


